
Food Labeling 2019 - Guide by Dietitians
Authors: Lucie Liang, McGill dietetics student & Sophia Zheng, registered dietitian

Disclaimer: The opinions expressed in the following article are those of the author(s), and do not necessarily reflect those of Foodoc.
Health Canada made several changes to food labelling regulations after obtaining feedbacks from customers and nutrition professionals. Once we know how to de-code the messages behind, food labels are very helpful when comparing similar products. The most informative sections include nutrition facts table and list of ingredients.
Nutrition Facts Table
Serving Size:
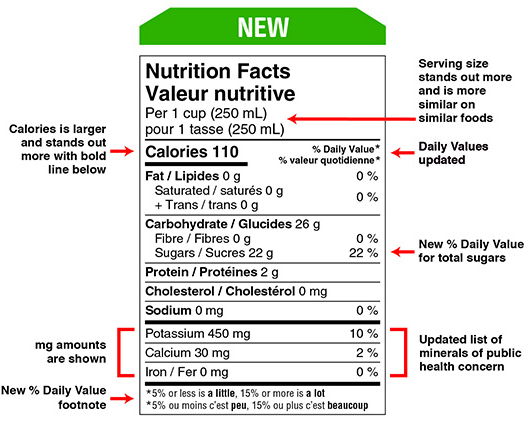
Serving size is the quantity unit based on which all the other values in the nutrition facts table are listed. One improvement made on the new label is the consistency of serving sizes for similar food items. Using juice as an example, you may see one brand using 250 ml as serving size and another using 125 ml. We would have to do some math to compare the two products fairly. With the new regulation implemented, we can compare nutritional values without frequent calculations.
Another important improvement is that the serving sizes are more realistic. For example, we typically consume one cup of cereals at a time, so those products using ½ cup as the serving size before would be asked to modify the information.
Font of the serving size is also increased to be easier to find. Serving sizes should be the first thing we look at, while in reality most of us go to the percent daily values first. If the serving size used is not what one typically consume, values on the rest of the table is meaningless.
Percent daily values:
The percentage on the right side of some nutrients is another information we can get from the table. This value is calculated by comparing the number of nutrients you can get from one serving of the food to the total amount of the nutrients you need in each day. For example, if one serving of yogurt contains 20% of calcium, meaning it fulfills 20% of your daily calcium need. To help customers better understand this value, a footnote is added to the bottom of the table. “5% or less is a little, 15% or more is a lot”. For example, if a product contains 20% of a certain nutrient, then it would be a good provider of this nutrient. Another improvement is that the daily value for total sugars is added, so we can keep track of our sugar consumption more closely.
List of nutrients:
Maybe you’ve noticed already, the minerals shown are not the same anymore. Vitamins A and C are removed since most Canadians consume a sufficient amount. The mineral added is potassium, which is important for cardiovascular health.
List of Ingredients
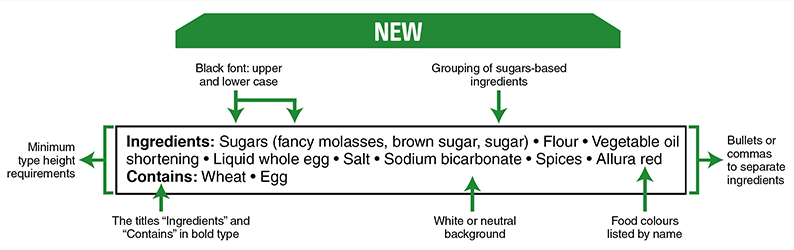
- A lot of regulations exist on things like font and background colors to make the list of ingredients more visible and understandable.
- Behind the word “sugars”, all the sugar-based ingredients are grouped together and shown in brackets. This way, we can find all the sugar sources in that food without trying to translate their scientific names.
- The order of ingredients listed now depends on the percent weight of that ingredient in the product. The first one listed weighs the most out of all ingredients, and vice versa. For example, if blueberry is not one of the first few ingredients in a blueberry granola bar, then it’s not a main ingredient.
Comparing similar products in the grocery store to find the most nutritious one can be very confusing. Health Canada has made their efforts to facilitate our selection processes, and we need to accomplish our part as well. Understanding the messages behind the information shown on the packages is the first step.